molanis.com/forum - Tools for MetaTrader : The place to ask about the best expert advisor builder, expert advisor downloads, and expert advisor programming

AFTER YOU REGISTER SEND US AN EMAIL TO ACTIVATE YOUR ACCOUNT - Before posting:-1- Please read the user guide -2- Try the examples -3- Search in the forum
It is currently Sun Apr 28, 2024 12:12 pm

All times are UTC - 5 hours


Post new topic Reply to topic  [ 11 posts ]  Go to page 1, 2  Next
Author Message
 Post subject: Slope of Indicators
PostPosted: Fri Nov 29, 2013 3:47 am 
Offline

Joined: Wed Jul 18, 2012 11:06 pm
Posts: 78
MikeT mentioned 'slope' in another thread.. .was hoping he could elaborate here and maybe provide us with a few links of worthwhile reading. I've heard of 'slope' indicators (nanningbob?) but never really looked into it too much, and have no idea of the logic behind them.

Hope to hear from you soon Mike..

Regards


Top
 Profile  
 
 Post subject: Re: Slope of Indicators
PostPosted: Tue Dec 03, 2013 2:18 pm 
Offline

Joined: Wed Aug 28, 2013 5:55 pm
Posts: 8
Hey MikeT

still no luck with what i am trying to do.....

Using the same Concept of the STOPLIGHT Indicator Lights.

I would Like an Indicator that does the following.

(Only for the Current Symbol)

iCustom Indicator that has a #property indicator_buffers 4

1) If a Trade is Open = Red

2) IF a Pending order has been set = Yellow

3) If a Market Order has been set = Yellow

4) If No Trade, No Pending Order or No Market Order is Open = Green

Attachment:
!MT4 MA SET3 STOPLIGHT.mq4 [13.16 KiB]
Downloaded 1024 times


Top
 Profile  
 
 Post subject: Re: Slope of Indicators
PostPosted: Tue Oct 28, 2014 10:49 am 
Offline

Joined: Thu Aug 23, 2012 2:00 pm
Posts: 49
Sorry Nolube/SeanDon... (been in a cave with only a spark to light my way)

If you guys are still around and interested I'll be happy to give my 2 cents worth to the thread... they really work for me and are crucial to my EA's...

Later

MikeT


Top
 Profile  
 
 Post subject: Re: Slope of Indicators
PostPosted: Thu Oct 30, 2014 7:04 am 
Offline

Joined: Tue Dec 22, 2009 12:22 am
Posts: 1761
We have been looking to include a slope feature but there are many ways of doing it that we have not decided. If you give us your 2 cents it will be appreciated. Thanks


Top
 Profile  
 
 Post subject: Re: Slope of Indicators
PostPosted: Sun Nov 02, 2014 4:48 pm 
Offline

Joined: Thu Aug 23, 2012 2:00 pm
Posts: 49
Sorry guys... been really busy like most of you.... but here's my 2 Zimbabwe cents worth....

Molanis... It's actually quite simple and I'm not sure that you guys are going to be able to do anything with this because you already have... Your Indi builder is perfect for creating "Slope" indi's....
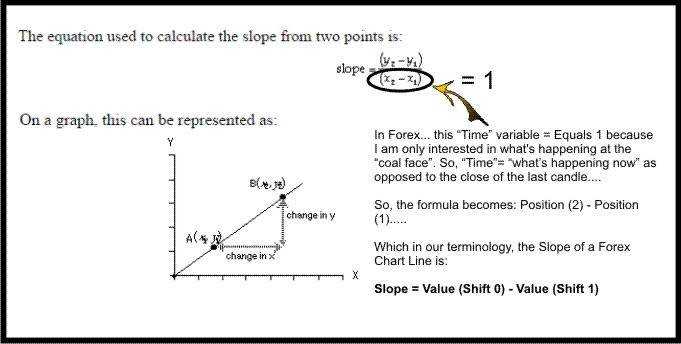
Shift 0 - Shift1

Maybe we should define "slope" w.r.t the Forex charts...

Attachment:
Slope Definition.jpg
Slope Definition.jpg [ 53.24 KiB | Viewed 15645 times ]


Hope you guys agree with that... but, the "slope" of a Forex line can mean 2 things in my opinion....

1. It tells you how quickly an indicator is moving...and,
2. When an indicator is loosing strength...ie. no lag.... and this is crucial because... All MA's are essentially "slopes" of a line over time.... If you take the "slope" of a MA (or any indicator) you will get a "Heads Up"....

Ok... so let's put this on a chart and have a look at where I am coming from... and look closely at the little arrows that show you where my EA entered and exited trades.... it's not that clear...sorry

Attachment:
Basic Chart Overlay.png
Basic Chart Overlay.png [ 97.63 KiB | Viewed 15690 times ]


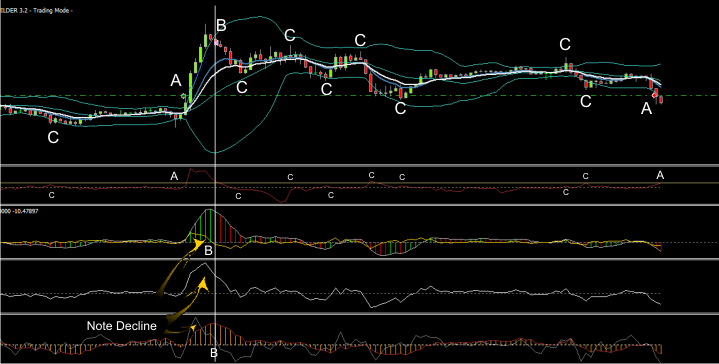
Sorry, I should have put more effort into this chart.... but basically.... the sub-window indicators are:

Note: Remember, we are looking at 2 types of "Slope" behavior (i. the actual slope and ii. when the slope deteriorates), so... from the Top.... indi's no:

1. An indicator that tells me (A) the slope of the Bollinger Bands (the Copper one that you can hardly see.... sorry... but there is another "Olive" line on that Indi that basically tells me (or rather the EA) when it is allowed to trade. The "angle" of the "Slope" of the Bollinger Bands is important to me here (entry). If the "slope" of the indicator does not reach a certain level then the EA will not enter the trade...(all the points "C" have not met those conditions and hence the EA did not enter a trade... If any of you ever wanted an indicator that keeps you out of a sidways market then you should really have a look at this...... but this could be any indicator..., then my second indi:

2. The MACD with it's "slope" line (Yellow)... no great shake's... but the "Slope" line give's me a heads up and tells me that the Top of the move is in sight (B).... (sorry, this is a 15min chart), so I get a heads up at least 15mins before price moves against the long position)... Then...

3. The "Slope" of a simple 13EMA...(B) again.... I'm not sure if you can pick it up from the chart, but this is absolutely priceless for getting your EA to stay out of entering a trade on the High/Low.... play around with this and you'll see what I mean... Then...

4. Another Histogram Indi of mine with it's "Slope" line...(B) again.... Remember... I'm not interested in the "noise" which is filtered out by 1. the Bollinger Band Indi (and it could be any indi)... but when the markets move... I really want to see what the slope of this indi is doing....I'm now concentrating on the "Exit"... When it crosses the Zero and the other indi's have also crossed the Zero (or are close)... I'm out...

Ok...

That's it in a nutshell.... do yourselves a favour and have a good look at this.... Molanis makes it soooo easy to create "Slope" indi's that there is no excuse to not play around...

There are obviously other aspects that come into play such as trading style... longer-time-frames, scalping...swing etc. etc....

...but as a filter... the "Slope" of your indi'd are priceless....

Anyways....

Hope I didn't bore you.... it works for me (and my EA/Trading Bots do 1% comfortably a day) based on the "slope" of my indi's....

Back to work.....

Look forward to other input....

Later
PS: there is another whole conversation about how to use the above in entering and exiting trades.... but if you read thru the above again then you should be able to work out the basics....

Anyways...

Good trading to you all....


Top
 Profile  
 
 Post subject: Re: Slope of Indicators
PostPosted: Sun Nov 02, 2014 5:06 pm 
Offline

Joined: Thu Aug 23, 2012 2:00 pm
Posts: 49
PPS:

The above indicators were just for illustration purposes... they are NOT my only indicators that I use... one's that I really find usefull are:

The ADX....ummm....Trend Magic (for exits - but a 5 bar H/L moving stop is actually better in my opinion)... I played around with the Aroon Oscillator (do a search - I posted .mol variations in a previous post)... it was ok but my other indi's basically told me the same thing....

I use a SMMA5 and a EMA13 looking at higher time-frames to help me with market direction... I also use the ROC (Rate Of Change) indicator but it must definitely be the "Slope"....

Markets have opened.... later


Top
 Profile  
 
 Post subject: Re: Slope of Indicators
PostPosted: Thu Nov 06, 2014 3:37 pm 
Offline

Joined: Tue Dec 22, 2009 12:22 am
Posts: 1761
Thanks
Great explanation. I think we can add those slopes in the next version since shift 0 - shift 1 is not complex
My only question is: You said:
Quote:
If the "slope" of the indicator does not reach a certain level then the EA will not enter the trade


How do you calculate that level?


Top
 Profile  
 
 Post subject: Re: Slope of Indicators
PostPosted: Thu Nov 06, 2014 4:54 pm 
Offline

Joined: Thu Aug 23, 2012 2:00 pm
Posts: 49
That's actually the key....

All I do is bring in a TA+ box (which you guys make so easy) that allows me to set a variable to the indicator (that I create before hand - Shift0 - Shift1). And it could be any one... but..
Have a look at the top indi in my example (the copper one)... it basically tells me the slope of the Bolinger Bands... so I simply set my EA to not take trades if that slope is less than a certain number.... that's where testing comes in so that you can identify the exact slope for each currency pair....

But generally they (the variables) are eactly the same... the only problem is Gold really... but just create Indi's for Gold as well.... then create indi's for each currency pair's Time-Frame (so that you can MTF back test your EA)... and that's pretty much it...

I also use more than one indi (variable) to confirm entrys/exits... I mean... I'll say the Bolinger Band slope must be higher that x...&& the AO slope must be higher than y....&& this indi must be higher than that etc...

But you can really eliminate sideways markets which are killers for breakout EA's....

Anyways... not sure if you are following me on this but it works like a charm.... all you have to do is establish the value (slope obviously) of the variable that you are focusing on... If the value of that variable is under a certain level then the EA will not trade... If it is over the variable level that you have established then the EA will enter a trade....

Sorry for rambling on... if you guys are still a bit confused I'll do another explanation... just really busy right now....

Hope that helps...

Later

MikeT
PS: For those of you who think that you'll just get away with me posting my indi's.... sorry, but that's not going to happen... and it's not because I don't want to give them to you... but it's because each indicator is based on a multiple of other indicators...

For eg. If I like an indicator... then I first import it into Molanis IB... then I create an indicator based on the selected "Mode#" of that indicator... I then create the exact asme indicator but based on different "Time-frames".... then I create indicators based on the slope of each of those.... It's easy... just do it...

I also create custom indicators that take a Percentage (%) value of several slope indicators... maybe 20% of this one... 10% of that one and 60% of another one..... that becomes a super Indi... but it's based on 10-15 different indicators....

If you know what I mean.... so it's not that I don't want to give you my indicators... it's simply a matter of them being built up by a whole lot of other indicators that I couln't even work out which "Bck ground" indicators I should send you.... Anyways... just thught I'd mention this...

But hey... Molanis makes it soooo easy to create Indi's that you have no excuse not to create them yourself in any event....

Again... if I'm confusing you... let me know and I'll put something visual together....

Later


Top
 Profile  
 
 Post subject: Re: Slope of Indicators
PostPosted: Thu Nov 06, 2014 5:44 pm 
Offline

Joined: Thu Aug 23, 2012 2:00 pm
Posts: 49
Sorry... to answer your question more clearly....

Each "Slope" indicator has a Zero line (basically when the indicator you are monitoring crosses from Pos to Neg or visa vers)...

So... basically you can then establish a number depending on the scale (I always multiply my "Slope" indi's by 100 000 so that I get whole numbers to deal with... The higher the "Slope" of the indi line... the higher the "Slope" indi value...

Then it becomes simple... if the "Slope" value is higher than 35 (for eg.) then you are allowed to enter trades... etc. etc.

Hope that makes more sense...

Later
PS: a must for any "Break-out" strat... anyways


Top
 Profile  
 
 Post subject: Re: Slope of Indicators
PostPosted: Thu Nov 06, 2014 6:43 pm 
Offline

Joined: Thu Aug 23, 2012 2:00 pm
Posts: 49
Shit.... there's actually a bit more to go with that...

Consider the 2 scenarios I spoke about earlier w.r.t the slope of a line. I said...

1. The value of that slope line (good for entries) ie. if a market is moving and one of your indi's turns up...then the value of that slope based on a "zero" line will become real positive....ie. the value of the slope indi will increase...

But...

2. It's really important to look at the angle of that "Slope" indi line (exits)... ie. is it positive or negative... and don't laugh... but that's the slope of the slope of the indicator...

A quick example... I'll put this into a graphic when I get time.... but consider this... a 13EMA...

- On a chart it will look like its going up.... if it's a strong enough move then your "Slope of the 13EMA) Indi will be high.. the value...but,
- At some point....even tough the 13EMA will be going up on your charts... the "Slope of the 13EMA" will be coming down.... This is cruicial when developing EA's... because now you can use that as a criteria to not enter any further Long positions... even though the 13EMA is still going up...

ie. The slope of the slope of the 13EMA is now negative (Shift0 - shift1).... and bingo.... don't enter any long trades...BUT the 13EMA is still going up....

Not only that, but now you can bring the zero line into play... as an eg. the MACD.... when the "Slope of the MACD" indi crosses the zero line... that could be an exit condition... but the "Slope of another indi (eg. 13EMA)" might be going up so it saves you from exiting a position...because your algorithmy should be...

Condition 1 Slope of MACD < 0
&& The "Slope" of the 13EMA must be going down , 0
&& Slope of AO < 0
&& etc. etc..


Sorry... I can go on at times...

But it really works... if you settle on the right indi's and have a good look at there "slope" personality.... and then combine them (not too many otherwize you will do your head in).... you will really create a good EA that filters certain criteria whilst still alowing it to trade.... sorry going off on a tangent again...

Hope that adds a bit to what I am saying...

Later...


Top
 Profile  
 
Display posts from previous:  Sort by  
Post new topic Reply to topic  [ 11 posts ]  Go to page 1, 2  Next

All times are UTC - 5 hours


You cannot post new topics in this forum
You cannot reply to topics in this forum
You cannot edit your posts in this forum
You cannot delete your posts in this forum
You cannot post attachments in this forum

Search for:
Jump to:  
cron
Powered by Molanis © 2009